Data
Synthetic Test
We’ll start with the synthetic benchmarks as they shed light on some of the results.
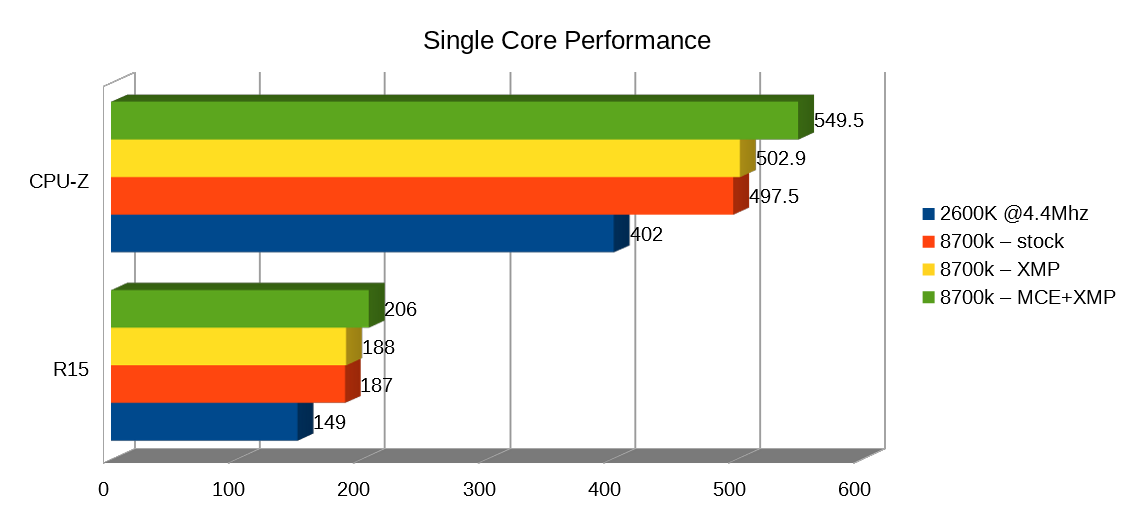
The single core performance of the 8700k is about 20% over my overclocked 2600k, not very impressive for 5 years of CPU development (and 6 generations of processors). And according to the Internert, single core performance for 8th gen i7, is very similar to 7th get i7, I however, cannot verify. However, please keep in mind that the 2600k was operating on 4.4Ghz over the stock 3.4Ghz. which by itself is a respectable gain as shown in this CPU-Z screen shot.
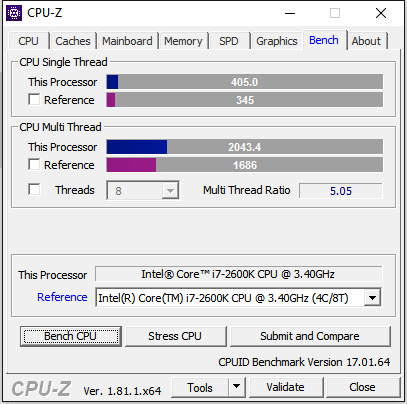
so my 2600k is already 15-20% over the stock. Which makes the gap between a stock 2600k and the 8700k closer to 30-35%.
Please note one data piece I cannot fully explain. Between stock speeds and stock speeds with XMP, there is virtually no difference in single core performance as expected. However with all the “OC checkboxes” enabled in BIOS, it seems that the single core performance has popped up, where it shouldn’t have. I believe this is due to one of the BIOS settings I’ve enabled. CPU multiplier was set by default to “Per-core” which means that the chipset/OS can bump up the voltage to one core when under load, boosting it up to the rated 4.7Ghz boost. However, in the final test (MCE) It also enables “Sync all cores” setting on the CPU multiplier.
Single core performance benchmarks (cinebench in particular) have a large job divided to small chunks. in multi-core testing, the maximum amount of parallelism is used, having all cores run something. however, in Single core testing, the list of small jobs are send one by one, causing only one thread to be active at a time. OS however, decides which thread will work, and every small task is generally run on a different core. Chipset then has to react and boost the new core. When all cores are synced, all cores are already on the boost clock, making single core performance seem a bit faster.
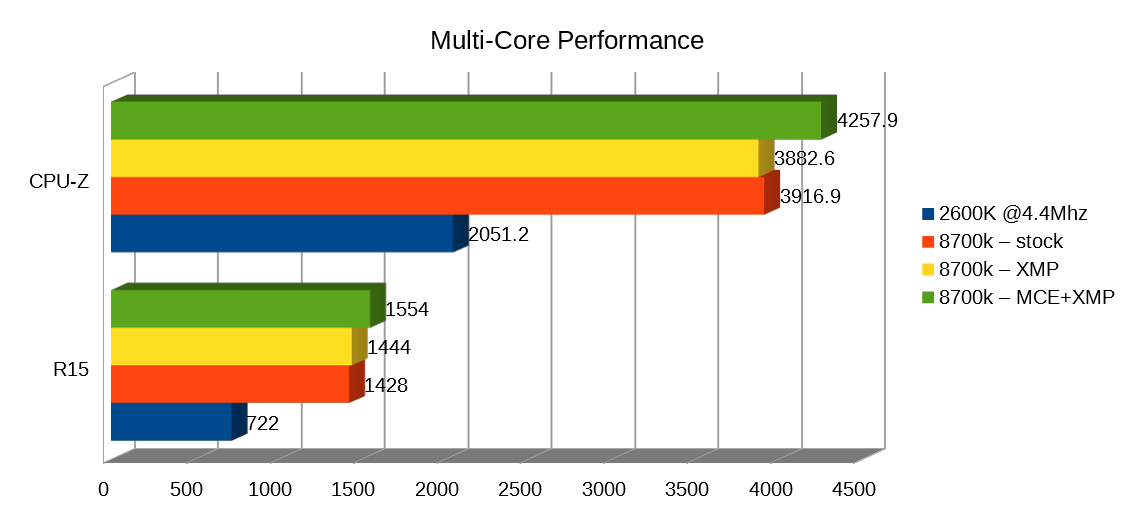
Multi core performance boost however, is massive. Those 20%+ of performance coupled with the addition of the he extra 2 cores (4 threads) over the 2600k produces about double the CPU performance. Which is critical on multi threaded operations. as we will see.
Please note, that for the scope of this test, I did not OC the CPU manually, but gave the Motherboard leave to do his own. This uncontrolled variation will lead to some difference on per-system bases, but not more then the silicon lottery will do anyway. This however does not negate the tests as we are looking for the large scale of change, rather then digging into the single frame improvements.
BMS
BMS first, as the data sets are simpler. BMS is well known to be very CPU bound. For that reason I chose to use a KTO day 1 mission in a campaign. This allows a “worst case scenario” to be demonstrated.
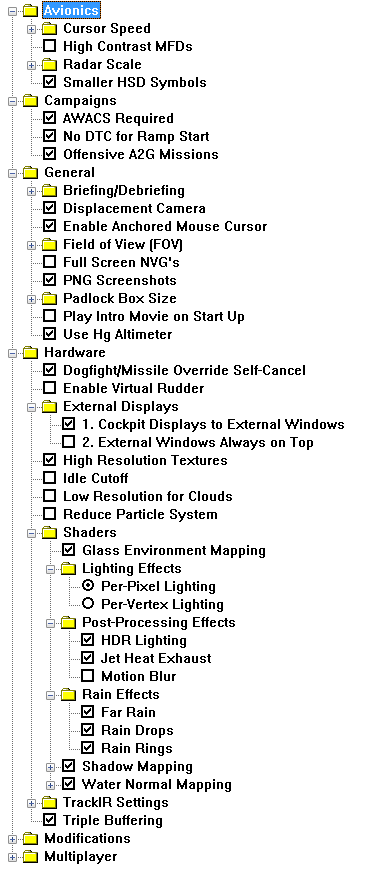
Graphics settings used for BMS testing:
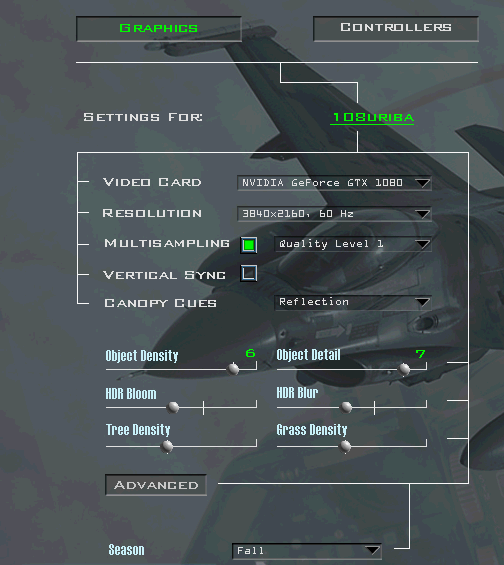
Now that we got all the formalities out for the way let’s get to work.
We’ll start by looking at the aggregated data.
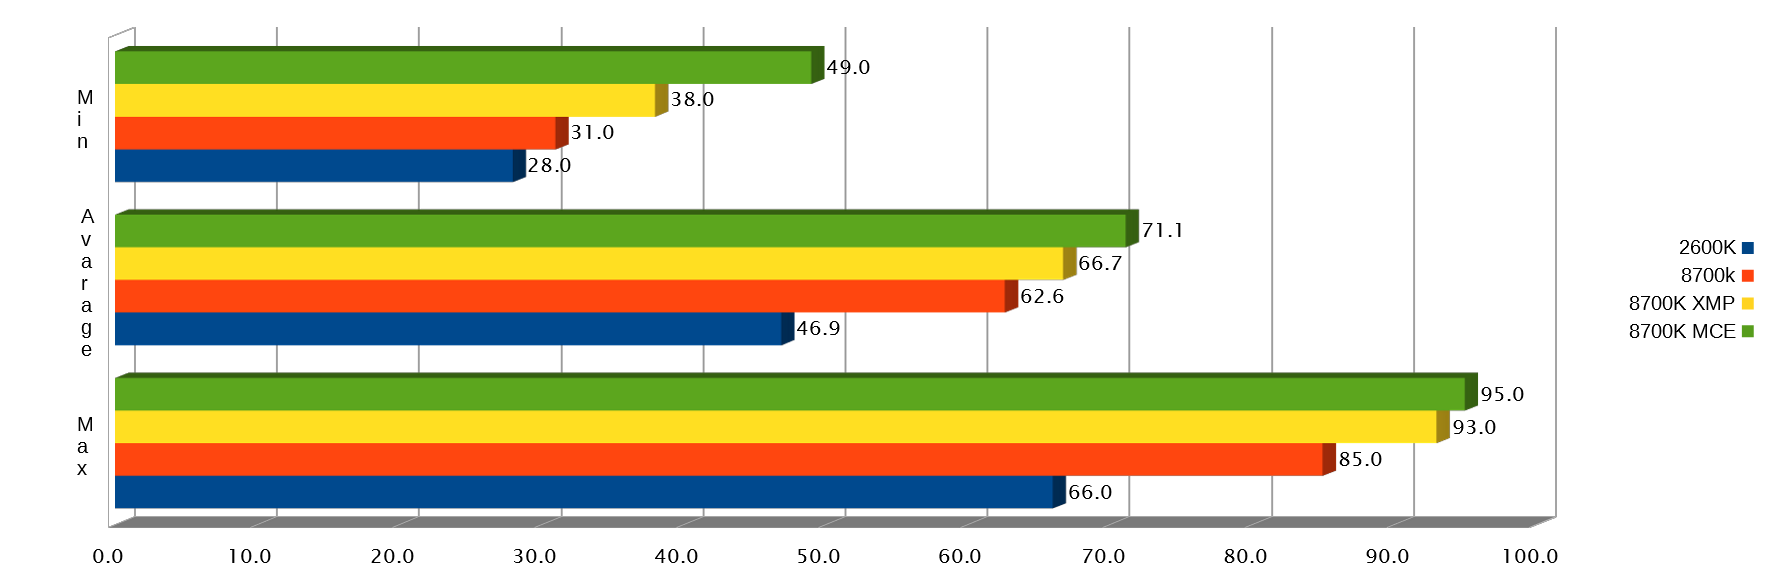
There is no surprise in the results. BMS scales directly with CPU single core performance. BMS pretty much pegs one thread to 100%, while there is a second is also in 70%+. However, it does only load those 2 cores in a significant way, which may indicate that the added 2 cores over the last gen 4 cores will not provide much of a benefit.
However, looking at those numbers show that average FPS scaled up pretty much by the ~20% of the single core performance boost. Also the bump in RAM speed with the XMP enabled, yielded a more stable minimum FPS. the Boost in the Min FPS with MCE, directly matches the “thread hopping” phenomena I’ve mentioned in the synthetic tests. As smaller tasks jump around threads in OS whim. it does have some affect on the Average FPS as well but not on the maximum (which is single core performance bound).
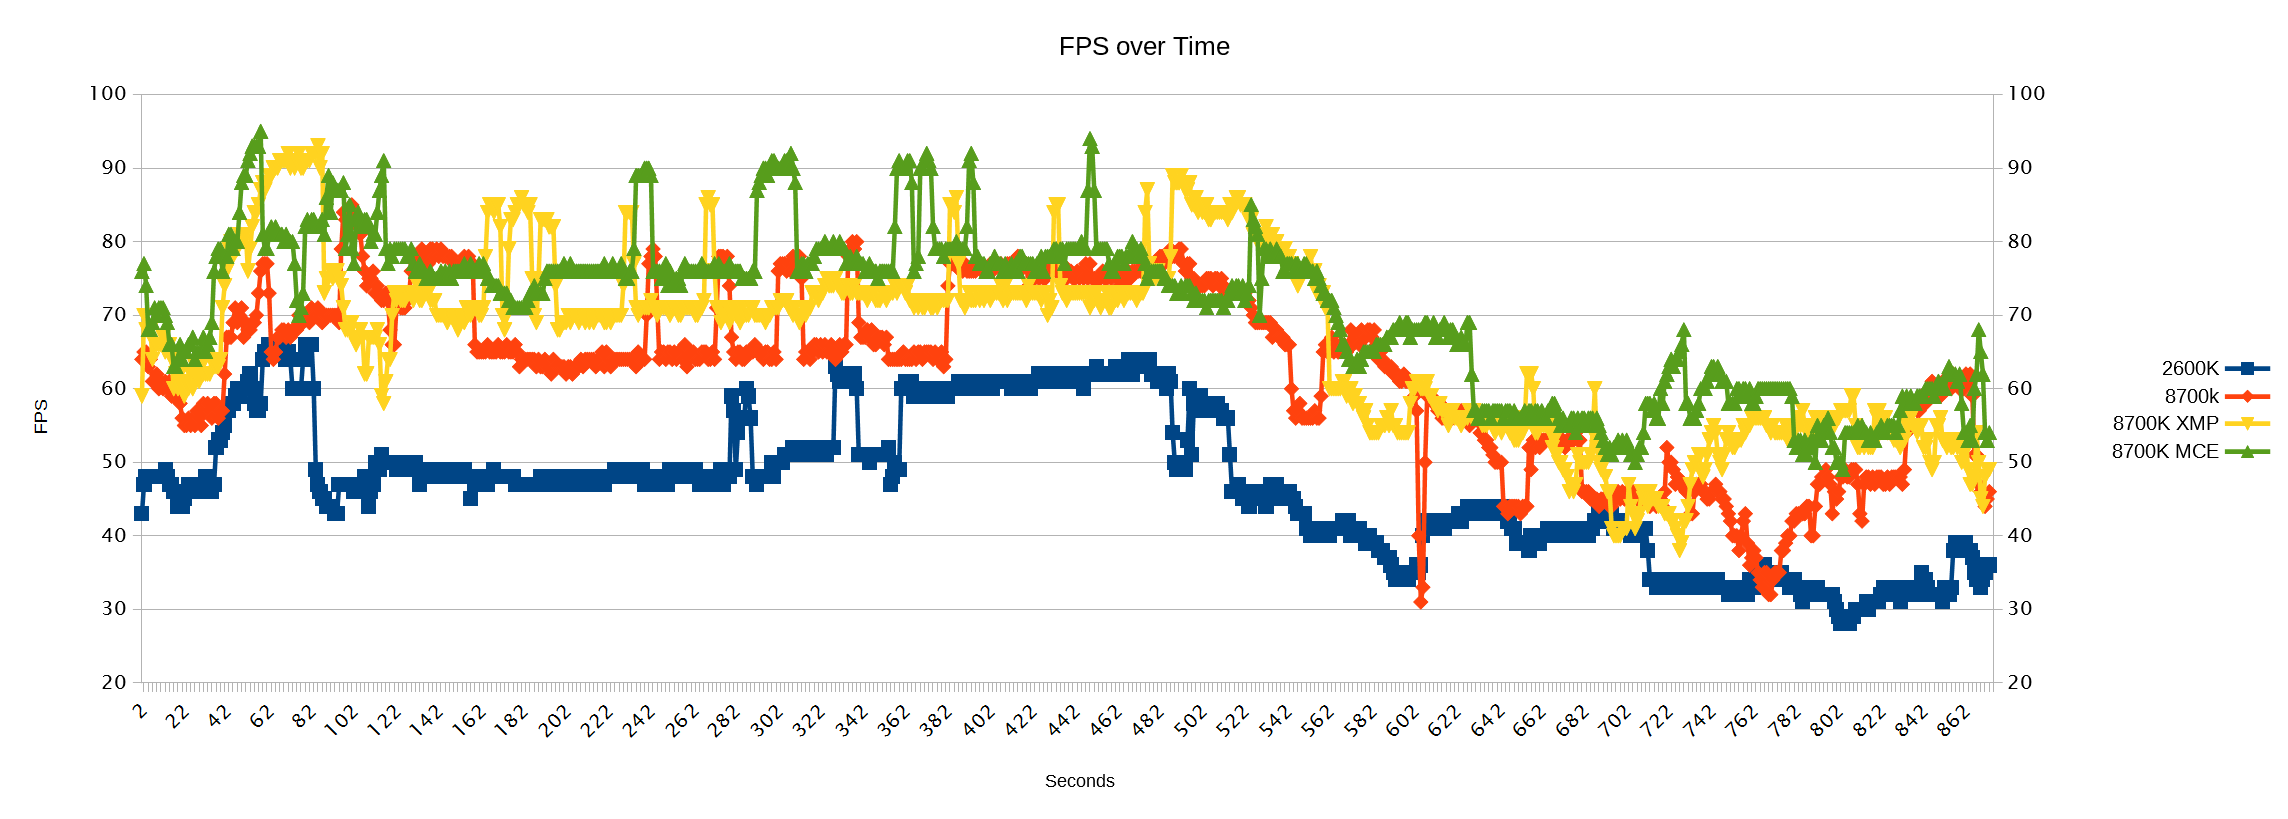
Looking at framerate over time, reveals some more interesting things. First, the “squared dips” popping up and down, are in fact directly linked to the TGP. FPS drops if TGP display is active on the MFD.
In addition, the closer you get to the FLOT the more CPU has to work. the “AI thread” (or maybe “Campaign thread”) works harder and harder, blocking the rest of the simulation, and lowering framerate as a result. That manifests with the framerate average going down starting around second 480 of the test.
One last thing to note, starting from around second 700, there is a deviation starting between the graphs, this is due to the fact that BMS has a dynamic campaign and not replay ability, I flew the same missions every time in the most consistent way I could. However, every run I had, the enemy was doing something else. Once I engaged Mig-23s. another time, jumped by Mig-29, on a third, a SA-2 battery opened up on me. Dispite all this, the results look consistent and framerate drops are to a higher minimum with the better CPU.